
Page 141 - python
P. 141
115
<img src="https://dsdi.msu.ac.th/images/msu-i.png" style="width:30px;height:30px;
margin-right:5px;float:left;"/>
<h1 style="font-family:'Athiti';font-size:10px"> {data.iloc[i]['name']}</h1>
"""
iframe = folium.IFrame(html=html, width=140, height=40)
popup = folium.Popup(iframe, max_width=2650)
folium.Marker(
location=[data.iloc[i]['lat'], data.iloc[i]['lng']],
popup=popup,
icon=folium.DivIcon(html=f"""<div><svg xmlns="http://www.w3.org/2000/svg">
<image href="https://dsdi.msu.ac.th/images/msu-i.png" height="50" width="50"/>
</svg></div>""")
).add_to(m)
M
ผลลัพธ
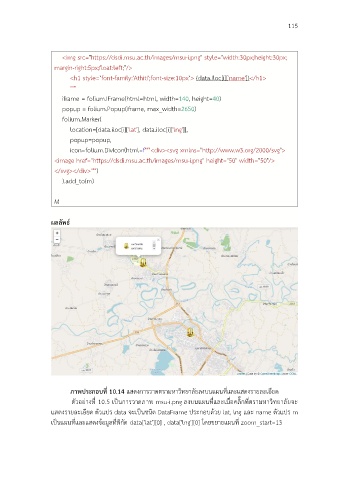
ภาพประกอบที่ 10.14 แสดงการวาดตรามหาวิทยาลัยลงบนแผนที่และแสดงรายละเอียด
ตัวอยางที่ 10.5 เปนการวาดภาพ msu-i.png ลงบนแผนที่และเมื่อคลิ๊กที่ตรามหาวิทยาลัยจะ
แสดงรายละเอียด ตัวแปร data จะเปนชนิด DataFrame ประกอบดวย lat, lng และ name ตัวแปร m
เปนแผนที่และแสดงขอมูลที่พิกัด data['lat'][0] , data['lng'][0] โดยขยายแผนท zoom_start=13
ี่